About
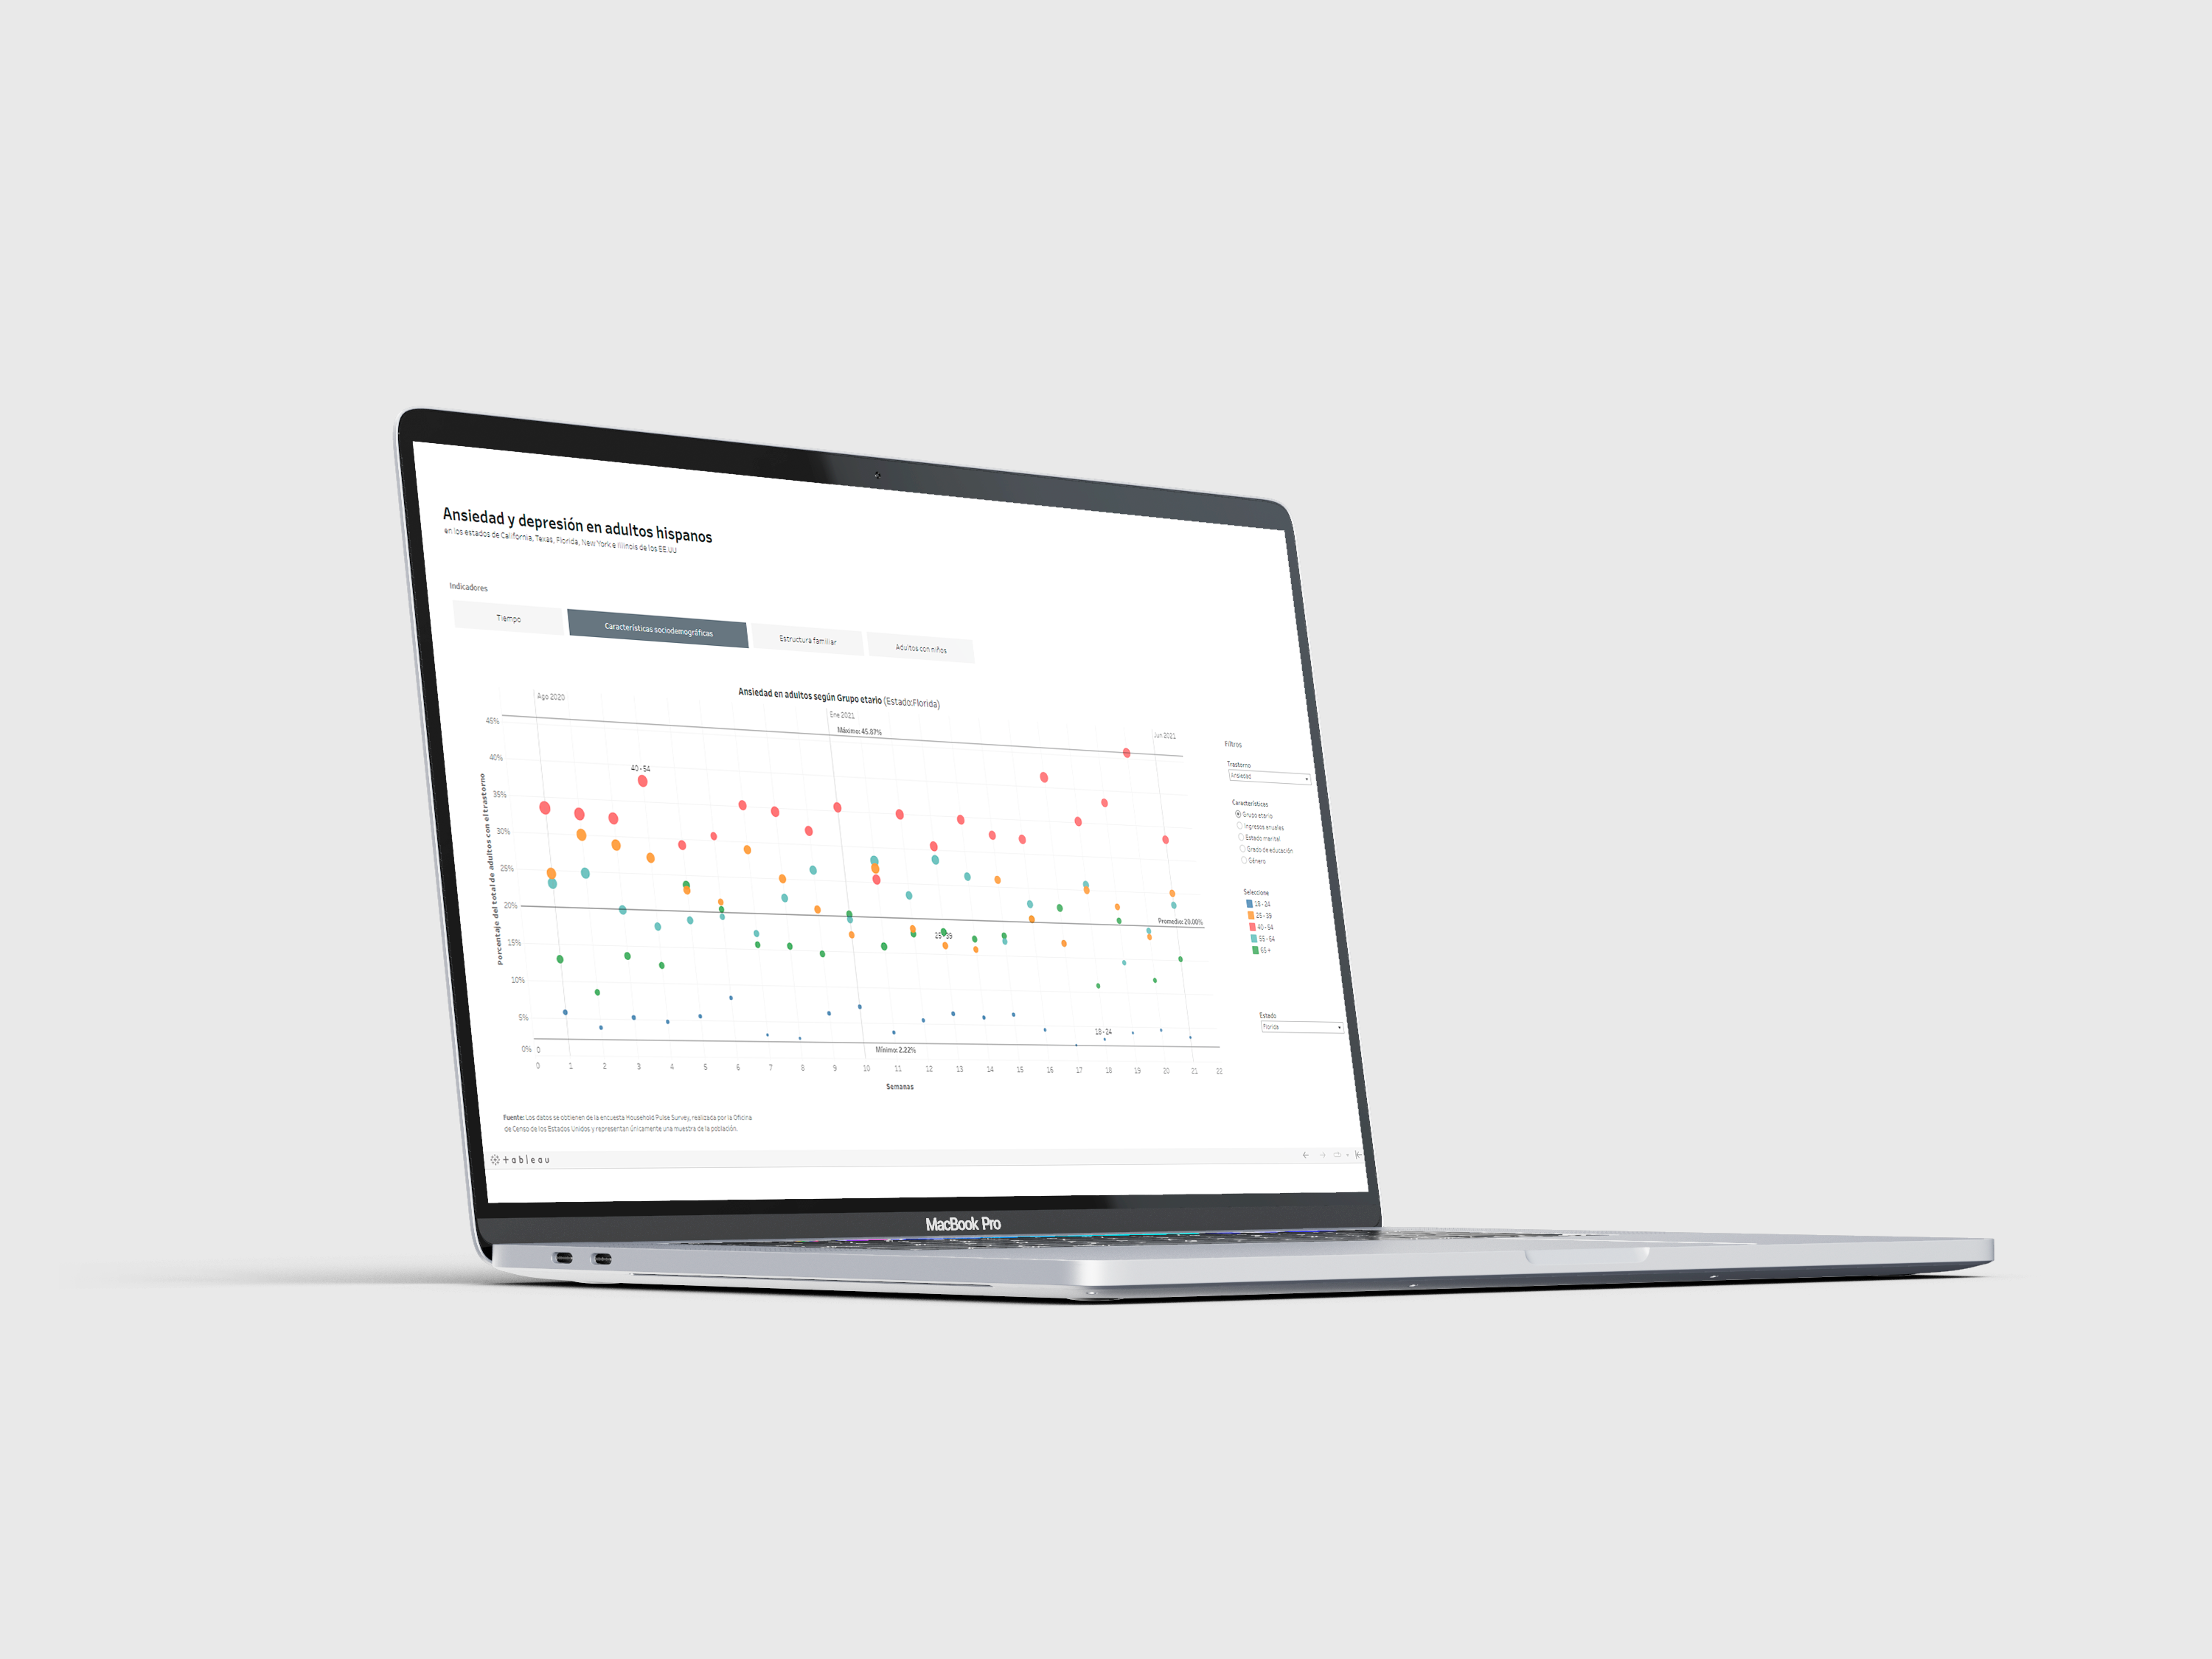
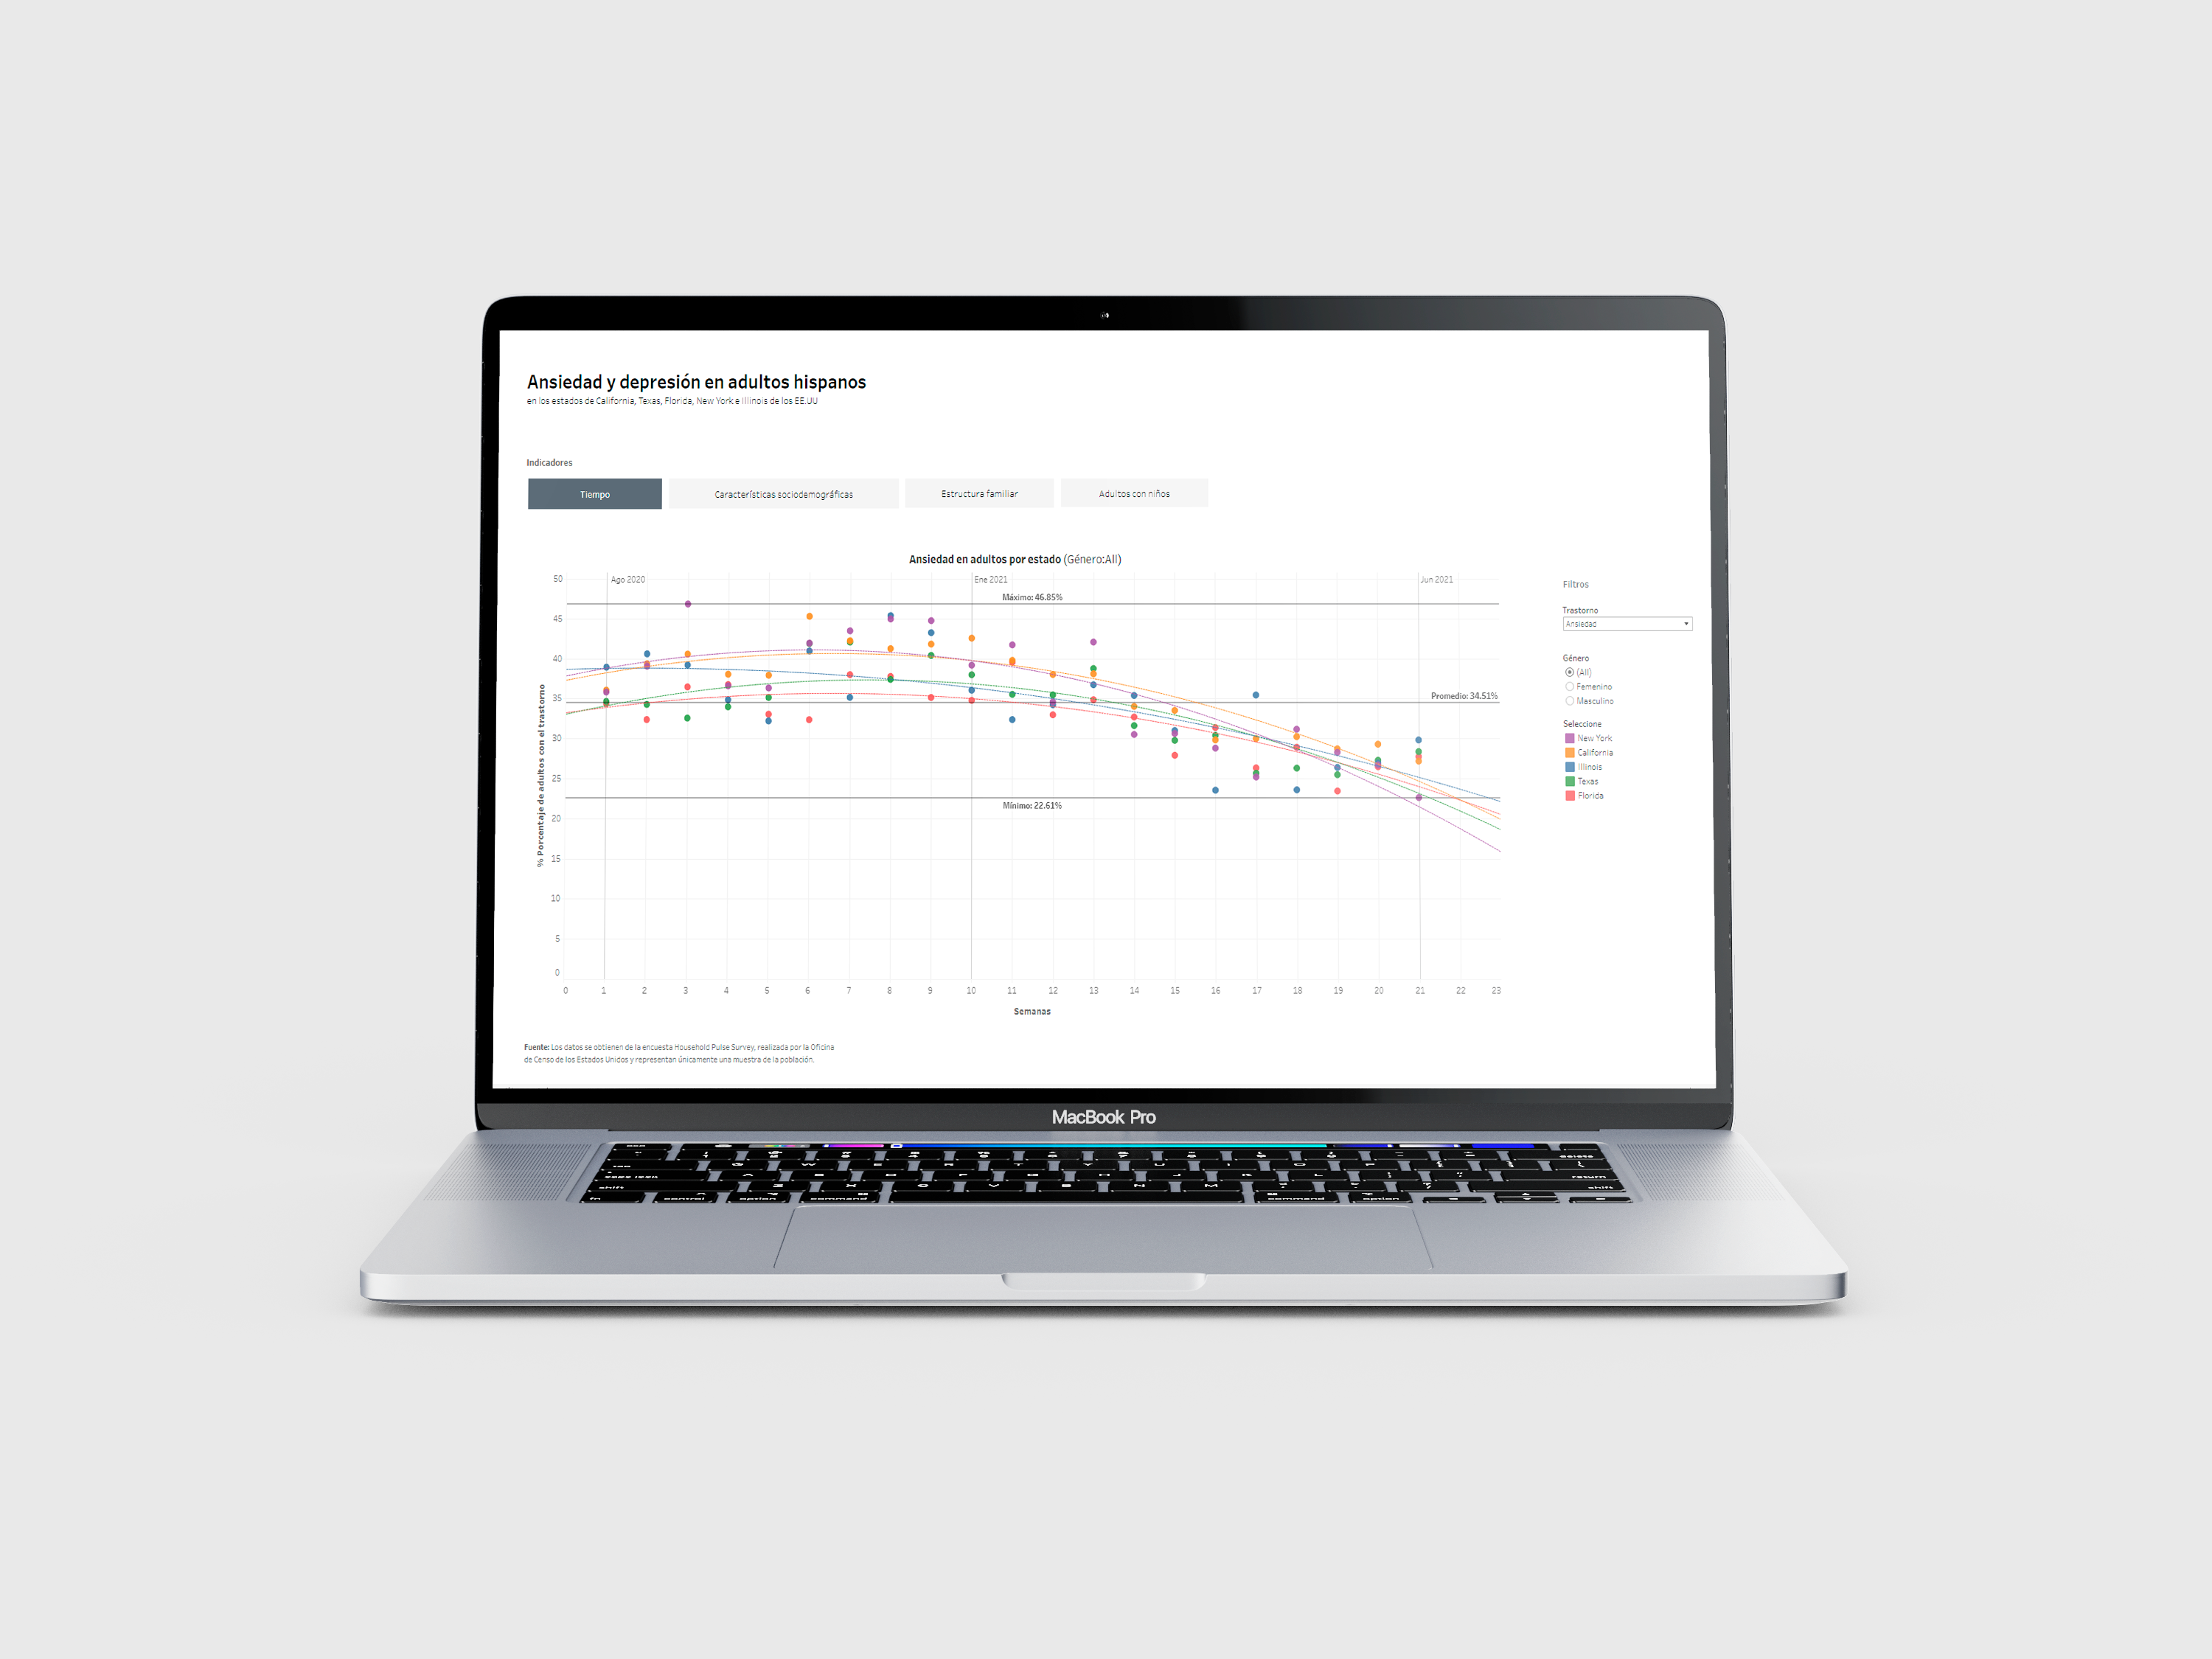
The objective of this project was to design a data visualization that contributed to the analysis of the Anxiety and depression behavior of the Hispanic populations across 5 states of the United States from August 2020 to June 2021. Also, the project answered the following objective questions: How did anxiety and depression behave among the Hispanic population in California, Florida, Texas, New York, and Illinois from August 2020 to June 2021?; Which population sectors have the most anxiety and depression?; Is there a correlation between family structure, anxiety, and depression?; Is there a correlation between school status, anxiety, and depression?
To answer these questions a scatter plot paradigm was used, which allowed to correlate a wide variety of data sets.